
GENDER DIVERSITY INDEX™
First Quarter 2026 Key Findings

GENDER DIVERSITY INDEX™
First Quarter 2026 Key Findings

PROGRESS TOWARD GENDER PARITY ON CORPORATE BOARDS SLIPS JUST BELOW 30%
In collaboration with our Exclusive Data Partner, Equilar, as of Q1 2026, women hold 29.9% of Russell 3000 company board seats, slipping below the 30% threshold reached in prior quarters and down from the Q1 2025 peak of 30.4%. The index included 2,843 active companies and 26,077 board seats.
Board composition changed by 241 seats during the quarter. Women gained 138 seats and lost 83, for a net increase of 55 seats. Men gained 404 seats and lost 218, for a net increase of 186 seats. While women continued to gain seats, men accounted for 77.2% of the change in board composition, underscoring that progress remains uneven.
Notably, 86.2% of seats gained by women were newly added board seats, while only 13.8% came from replacing male directors. This reinforces a consistent trend: women’s gains continue to rely more heavily on expansion than on intentional board refreshment.
29.9%
of Russell 3000 board seats are held by women.
22.8%
of board composition change went to women.
86.2%
of seats gained by women were newly added board seats.

COMPANY RATINGS
Company ratings changed only modestly from Q4 2025 to Q1 2026, but the overall picture remains concerning. Gender-balanced boards declined from 383 to 375 companies, representing 13.2% of Russell 3000 companies.
Companies with three or more women directors also declined slightly, from 1,274 to 1,266 companies, though they represent 44.5% of the index. At the same time, 1,202 companies, or 42.3%, still have two or fewer women directors, including 80 companies with no women on the board.
These ratings show that while 57.7% of Russell 3000 Index companies have 3 or more women, a significant share of public company boards remain far from gender-balanced.
Our company ratings categorize public boards as Gender Balanced (GB), or with three or more women on board, two, one, or zero, providing a comprehensive snapshot of their gender diversity profile.

375 companies, down by 8 companies from Q4 2025.
1,266 companies, down by 8 companies from Q4 2025.
744 or 26.2% companies have two women, down by 17 companies; 378 or 13.3% have one woman, down by one company; and 80 or 2.8% have zero women directors, up by one company.
RACE & ETHNICITY
In Q1 2026, 41.4% of directors reported race and ethnicity, a slight decline from Q4 2025. Women directors continued to disclose at higher rates than men, with approximately 51% of women directors disclosing race and ethnicity compared to 37% of men directors.
People of color held 18.6% of board seats, down slightly from 18.8% in Q4 2025. Women of color held 7.3% of all board seats, compared to 7.4% in Q4 2025, while men of color held 11.2%, a slight change from 11.3% in the prior quarter.
The data reinforces the need to look beyond aggregate gender metrics. While overall gender diversity remains near 30%, women of color continue to hold a small share of board seats, signaling the need for more intentional and intersectional board recruitment practices.
- Women
- Men
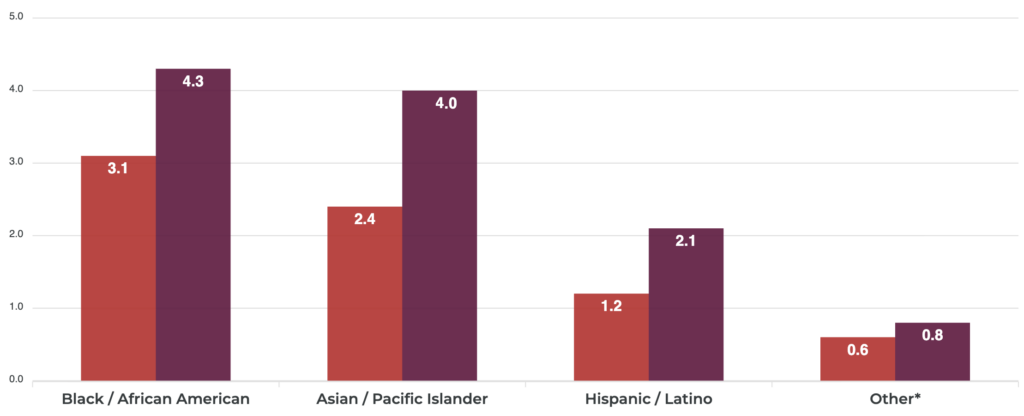
* Other includes those who self-identify as Indigenous, Middle Eastern/North African, Multi-racial or other.


Companies By Sector
Sector performance continues to vary widely. Utilities led the Russell 3000, with women holding 35.7% of board seats and 27% gender-balanced companies. Consumer Cyclical, Real Estate and Consumer Defensive also outperformed the national average, with women holding approximately 32% to 33% of board seats across each sector.
Energy and Financial Services continued to trail. Women held 26% of Energy board seats and 28.2% of Financial Services board seats. Energy also reported the lowest percentage of gender-balanced boards at 3.9%.
The sector data shows that progress is not evenly distributed. Leading sectors demonstrate what is possible, while lagging sectors point to where more disciplined succession planning and broader candidate consideration are needed.
UTILITIES
35.7% Women on Boards
27.0% Gender-Balanced Boards
CONSUMER DEFENSIVE
32.8% Women on Boards
17.4% Gender-Balanced Boards
CONSUMER CYCLICAL
32.7% Women on Boards
18.3% Gender-Balanced Boards
REAL ESTATE
32.2% Women on Boards
18.8% Gender-Balanced Boards
BASIC MATERIALS
30.3% Women on Boards
10.3% Gender-Balanced Boards
HEALTHCARE
29.7% Women on Boards
14.9% Gender-Balanced Boards
TECHNOLOGY
29.4% Women on Boards
11.4% Gender-Balanced Boards
INDUSTRIALS
29.2% Women on Boards
8.3% Gender-Balanced Boards
COMMUNICATION SERVICES
28.5% Women on Boards
14.7% Gender-Balanced Boards
FINANCIAL SERVICES
28.2% Women on Boards
11.0% Gender-Balanced Boards
ENERGY
26.0% Women on Boards
3.9% Gender-Balanced Boards
State Progress
Among states with a significant Russell 3000 presence, Minnesota and Washington continued to lead, with women holding 34% and 33.7% of board seats, respectively.
California, one of the largest markets in the index, reported 32.4% women on boards in Q1 2026, slightly below 32.6% in Q4 2025 but still above the national average. Colorado reported 28.8% women on boards.
Several states remained below the national benchmark, including Nevada at 23.9%, Oklahoma at 24.4%, and North Carolina at 26.6%. These gaps reinforce that national progress depends on stronger board renewal practices across local markets.
WOB = Women on Boards GB = Gender Balanced
GB = Gender Balanced
- Exceeds
- Average
- Below
When Women Lead
Companies with women in key leadership roles continue to report stronger board diversity outcomes. In Q1 2026, companies with a woman CEO reported 41% women on boards, compared to 26.7% at companies with no women in board leadership.
The strongest outcomes appeared when women held multiple leadership roles. Companies with women serving as CEO, Board Chair, and Nominating and Governance Chair reported 46.7% women on boards, 25.7% people of color, 13% women of color, and make up 56% of total gender-balanced boards.
This pattern reinforces a consistent finding: women in leadership roles are associated with stronger board composition outcomes and more sustained progress toward gender balance.

WOB = Women on Boards POC = People of Color WOC = Women of Color GB = Gender Balanced
Women CEO:
218 Companies
Women Board Chair:
279 Companies
Women Nom/Gov Chair:
906 Companies
When Women Hold All Three Positions: 25 Companies
One Woman Leader:
1,168 Companies
No Women Leaders:
1,675 Companies
WOB = Women on Boards
POC = People of Color
WOC = Women of Color
GB = Gender Balanced
Women CEO:
218 Companies
Women Board Chair:
279 Companies
Women Nom Chair:
906 Companies
When Women Hold All Three Positions: 25 Companies
One Woman Leader:
1,168 Companies
No Women Leaders:
1,675 Companies
METHODOLOGY
50/50 Women on Boards Gender Diversity Index™ reports on the gender composition of corporate boards on the Russell 3000 Index. Using data provided by our Exclusive Data Partner, Equilar, we analyze, track, and publish quarterly data through our Gender Diversity Directory. This Q1 2026 report reflects data as of March 31, 2026, covering 2,843 active companies and 26,077 board seats in the Russell 3000 Index.
Start Your Board Leadership Search or Support Others
For women seeking board service:
Continue building visibility, strengthening your governance profile, and communicating your board goals to trusted sponsors, peers, and decision-makers.
For corporations:
Invest in board-readiness education, support leadership pathways for high-potential executives, expand board candidate sourcing beyond traditional networks, and include board tenure and term limits as part of nominating and governance practices.
For men and current directors:
Mentor, sponsor, and actively recommend women for board opportunities, particularly women of color and candidates who may not yet be visible through traditional board networks.


Code of Conduct: Governing Data & Emerging Tech
Boards are no longer observers of emerging technology; they are stewards of how it’s governed. This panel goes beyond awareness to examine how directors can structure oversight, define accountability, and measure governance effectiveness in AI, data use, and digital innovation. Panelists will share practical strategies for building governance systems that ensure transparency, ethical decision-making, and responsible innovation at scale.
Speakers include: Sita Lowman, Nithya Das, Suresh Sharma, Byron Loflin
Your First Board Meeting: A Director’s Playbook
Tactics that Work: Case Studies in Navigating Shareholder Activism
Inside the Boardroom: Resilience Planning in Action
Reputation & Response: How Boards Navigate Shareholder Activism
As shareholder activism intensifies, boards face mounting pressure to defend strategy, protect corporate reputation, and engage stakeholders with clarity. This panel brings together seasoned directors to explore how boards can respond effectively while maintaining credibility, board alignment, and stakeholder trust. Hear real-world insights on navigating activism in today’s high-stakes, high-visibility environment.
Speakers include: Gaby Sulzberger, David Cahoy, Rachael Coffey, Eduardo Gallego
Navigating Global Markets: Trade, Tariffs, and Supply Chain Strategy
As global disruptions reshape business models, this panel will explore how boards can navigate the practical complexities of trade, tariffs, and supply chain shifts across regions. Panelists will share how directors are guiding companies through regulatory changes, sourcing challenges, and new market risks, while seizing opportunities for growth and operational agility.
Speakers include: Titi Cole, Mia Mends
Strengthening Oversight: Risk Management and Board Resilience
This keynote will equip directors to think globally about risk through the lens of geopolitical foresight, cross-border tensions, and long-term instability. Learn how boards can strengthen oversight and guide enterprise-wide resilience by anticipating disruption and embedding a proactive risk culture in a changing world.
Speakers include: Rodger Baker